Blood Glucose Sugar Level Chart: Normal Ranges by Age, Diabetes Levels & What’s Dangerous

Managing your metabolic health starts with understanding your numbers. Over the years in my endocrinology practice, I have handed out thousands of printouts to patients desperately trying to decipher their lab results.
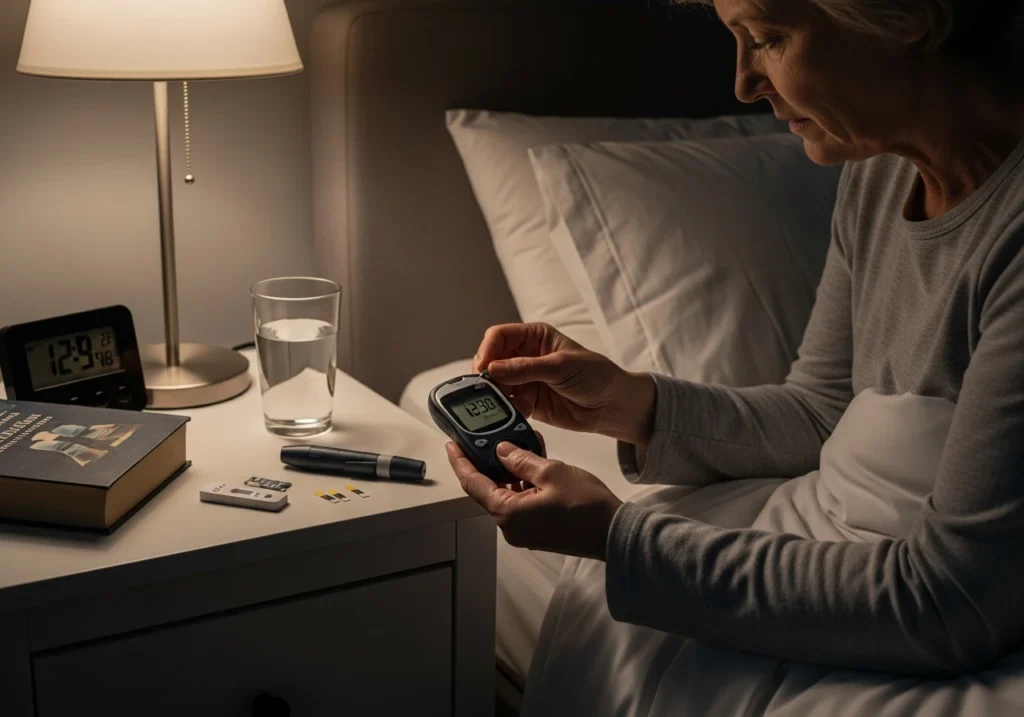
Just last week, a patient named Robert brought in a notebook filled with erratic numbers, panicked because his morning reading was 110 mg/dL. He didn’t know if he was prediabetic, diabetic, or just aging normally.
To help you avoid this confusion, having a clear blood glucose sugar level chart is an indispensable tool for taking control of your health.
Whether you are newly diagnosed with type 2 diabetes, managing prediabetes, or simply striving for optimal longevity, knowing exactly where your numbers should sit is critical. Your blood sugar is not a static number; it ebbs and flows with every meal, every stressful event, and every passing decade.
This comprehensive, evidence-based guide will break down exactly what these numbers mean. We will explore age-specific targets, the differences between milligrams per deciliter (mg/dL) and millimoles per liter (mmol/L), what constitutes a dangerous level, and actionable steps you can take today to stabilize your glucose.
Key Takeaways
- Blood sugar ranges are not one-size-fits-all; they vary significantly by your age, your health status, and whether you have diabetes.
- Consistent monitoring at the right times (fasting and two hours post-meal) is essential for gathering useful metabolic data.
- Never use these charts to self-diagnose. Use them as a daily guide, but always rely on professional lab work (like an HbA1c test) for an official diagnosis.
What Is a Normal Glucose Sugar Level?
When patients sit in my office, the very first question they ask is, “Doctor, what is a normal glucose sugar level?” The answer depends on when you last ate.
A normal fasting blood glucose level—meaning you have not consumed any calories for at least eight hours—is typically between 70 and 99 mg/dL.
After you eat a meal, your body breaks down carbohydrates into glucose, causing a natural spike. For most healthy adults without metabolic dysfunction, these levels should safely return to under 140 mg/dL within two hours of eating.
Normal Blood Sugar Levels Chart (mg/dL)
In the United States, we measure blood glucose in milligrams per deciliter (mg/dL). Below is the standard diagnostic normal blood sugar levels chart used by endocrinologists to assess metabolic health:
| Category | Fasting (mg/dL) | 2 Hours After Meals (mg/dL) |
| Normal | 70–99 | <140 |
| Prediabetes | 100–125 | 140–199 |
| Diabetes | 126 or higher | 200 or higher |
If your fasting numbers consistently fall into the prediabetes range, do not panic. This is your body’s early warning system, giving you the opportunity to reverse the trajectory through diet and lifestyle modifications.
Normal Blood Sugar Levels Chart in mmol/L
Outside the US, most countries measure blood glucose in millimoles per liter (mmol/L). To ensure you can interpret any lab result worldwide, here is the equivalent normal blood sugar levels chart in mmol/L:
| Category | Fasting (mmol/L) | 2 Hours After Meals (mmol/L) |
| Normal | 3.9–5.5 | <7.8 |
| Prediabetes | 5.6–6.9 | 7.8–11.0 |
| Diabetes | 7.0 or higher | 11.1 or higher |
(Pro-tip: To convert mmol/L to mg/dL, simply multiply the mmol/L number by 18).
Blood Sugar Levels by Age Chart

As we age, our cellular machinery becomes slightly less efficient at utilizing insulin. Therefore, a blood sugar levels by age chart reflects slightly looser targets for older populations.
When reviewing a blood glucose sugar level chart age-wise, the primary clinical goal shifts. For younger adults, the goal is strict control to prevent long-term complications.
For older adults, the goal is maintaining balance while strictly avoiding hypoglycemia (dangerously low blood sugar), which can cause fatal falls.
Blood Sugar Levels Chart by Age 60
When patients reach their sixties, we often adjust their targets. Looking at a blood sugar levels chart by age 60, a fasting glucose between 80 and 130 mg/dL is generally considered acceptable and safe.
After meals, we aim to keep their levels below 180 mg/dL. Pushing a 65-year-old’s fasting glucose down to 75 mg/dL with heavy medication often introduces more risks than benefits.
Blood Sugar Levels Chart by Age 70
By the time we reach our seventies, safety is paramount. On a blood sugar levels chart by age 70, slightly higher targets are entirely acceptable.
The focus shifts heavily to avoiding hypoglycemia. An overly aggressive treatment plan that causes a senior to pass out from low blood sugar is far more dangerous in the short term than a slightly elevated A1c. Fasting targets may be safely maintained up to 140 mg/dL depending on the patient’s overall health profile.
Glucose Levels Chart for Seniors
When creating a personalized glucose levels chart for seniors or establishing normal blood sugar levels for older adults, endocrinologists consider several vital factors beyond just the number.
We must assess the patient’s level of frailty. A robust, active 80-year-old will have stricter targets than an 80-year-old struggling with mobility.
We also account for medication sensitivity and comorbidities like kidney disease or cognitive decline. In complex senior cases, an acceptable fasting range might be officially adjusted to 90–150 mg/dL to ensure maximum daily safety.
Blood Sugar Levels for Type 2 Diabetes
If you have already been diagnosed, your targets will differ from those of someone without the disease. The American Diabetes Association sets specific blood sugar levels for type 2 diabetes management.
The ideal fasting target for a diabetic patient is between 80 and 130 mg/dL.
Two hours after the start of a meal, the post-prandial target should remain below 180 mg/dL. Consistently hitting these targets significantly reduces the risk of nerve damage, kidney failure, and cardiovascular disease.
Normal Blood Sugar Levels Chart HbA1c
While daily finger pricks give you a snapshot of this exact moment, your Hemoglobin A1c (HbA1c) provides a sweeping panoramic view. The HbA1c test measures the percentage of your red blood cells that have sugar-coated hemoglobin attached to them.
Because red blood cells live for roughly three months, this test reveals your average blood glucose over that entire 90-day period. Here is the standard normal blood sugar levels chart, HbA1c used in clinical diagnostics:
| HbA1c Percentage (%) | Clinical Meaning |
| Below 5.7% | Normal Metabolic Health |
| 5.7% – 6.4% | Prediabetes (Increased Risk) |
| 6.5% or higher | Diabetes |
I tell my patients to think of daily testing as checking the daily weather, whereas the HbA1c is evaluating the overall climate. Both are essential for a complete understanding of your health.
What Level of Blood Sugar Is Dangerous?
Just last month, a patient named Maria called my emergency clinic line. She was sweating, trembling, and her vision was blurring. Her meter read 55 mg/dL. We immediately instructed her to consume fast-acting carbohydrates.
Many patients ask me, exactly what level of blood sugar is dangerous for type 2 diabetes? Danger exists at both extreme ends of the spectrum, and recognizing these zones can quite literally save your life.
Hypoglycemia (Dangerously Low): Any reading below 70 mg/dL is considered hypoglycemic. If it drops below 55 mg/dL, it is a severe medical emergency that can lead to seizures, loss of consciousness, or even a coma.
Severe Hyperglycemia (Dangerously High): On the flip side, consistently reading above 300 mg/dL is extremely dangerous. This level of severe hyperglycemia can trigger a life-threatening condition called Diabetic Ketoacidosis (DKA) or Hyperosmolar Hyperglycemic State (HHS), requiring immediate hospital intervention.
Is 170 Sugar Normal After Eating?
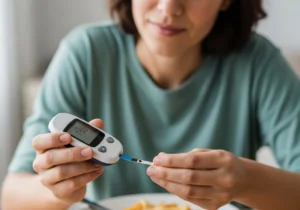
It is incredibly common to test your blood one to two hours after a heavy pasta dinner and see a number that alarms you. A frequent question I receive is: is 170 sugar normal after eating?
The answer depends entirely on your underlying pancreatic health. If you are a diagnosed diabetic, a reading of 170 mg/dL two hours after a meal is actually acceptable, as the clinical target is keeping it under 180 mg/dL.
However, if you are a non-diabetic, healthy adult, a reading of 170 mg/dL is elevated. A fully functioning metabolism should produce enough insulin to bring that post-meal spike down below 140 mg/dL within two hours. If you consistently see 170 mg/dL, it is time to screen for prediabetes.
What Does 7.7 or 10.2 Blood Sugar Mean After Eating?
For my international patients using the mmol/L metric, interpreting post-meal numbers can be just as confusing. Let’s break down two common post-prandial (after-meal) readings.
A 7.7 blood sugar level after eating translates to roughly 139 mg/dL. This is an excellent, normal reading. It indicates your body efficiently processed the carbohydrates and successfully cleared the glucose from your bloodstream.
Conversely, a 10.2 blood sugar level after eating translates to about 184 mg/dL. This is an elevated reading. For a healthy individual, this is a clear sign of insulin resistance. For a diabetic, it is just slightly above the ideal target and suggests your meal might have been too carb-heavy.
Blood Sugar Glucose Level Chart & Supplements
Patients are frequently targeted by aggressive marketing for “miracle” supplements promising to cure diabetes. When incorporating a blood sugar glucose level chart supplement plan, you must remain grounded in medical science.
Certain supplements, such as Berberine, Cinnamon extract, and Alpha-Lipoic Acid, have shown mild clinical efficacy in improving insulin sensitivity. They can be helpful additions to your regimen.
However, supplements should absolutely never replace your prescribed medications like Metformin or Insulin. They are supplemental, not foundational. Always consult your endocrinologist before mixing herbal extracts with your pharmaceutical treatments to avoid dangerous hypoglycemic drops.
Foods That Help Maintain Healthy Blood Sugar
Diet is the ultimate lever you can pull to control your numbers. Understanding how specific foods interact with your metabolic system is more powerful than any chart.
Vegetable Selections for Stable Glucose
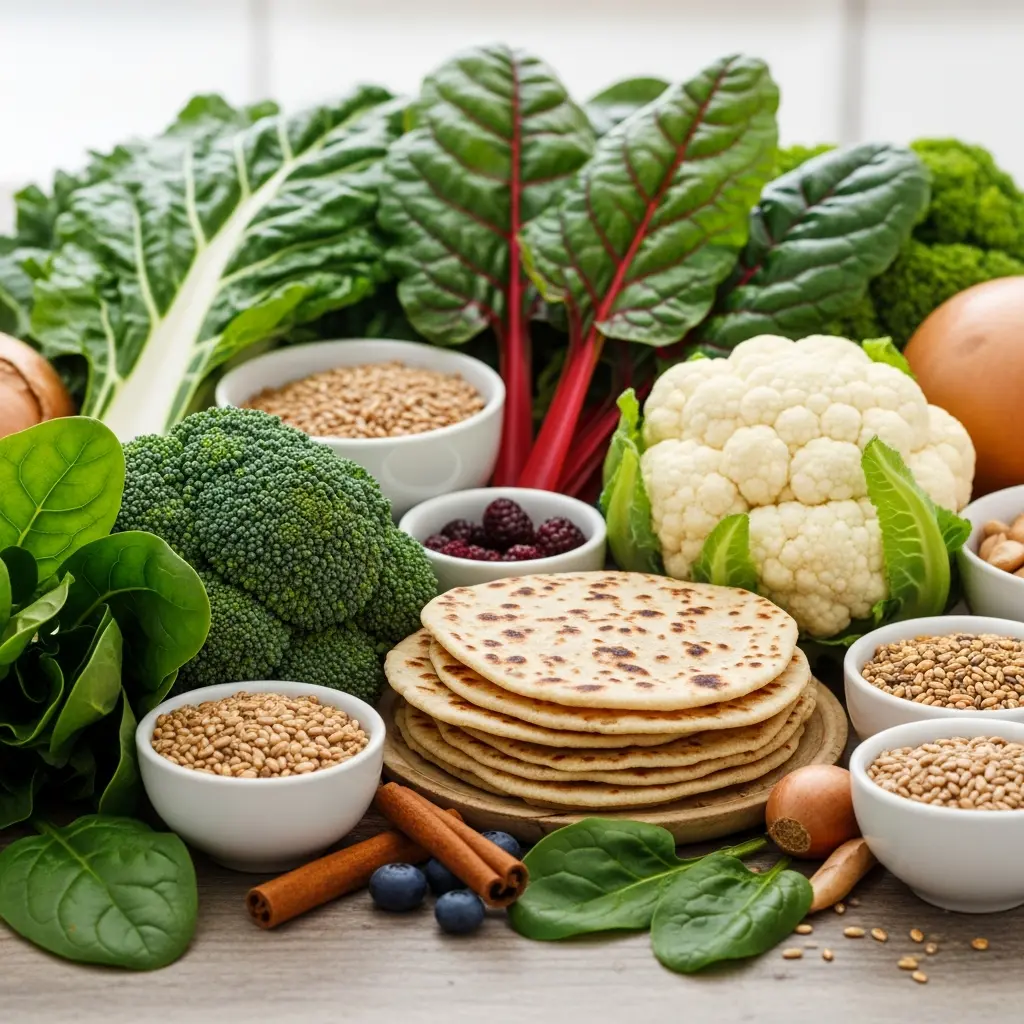
Patients frequently ask me, “Which vegetable is good for diabetes?” The clinical answer always points toward non-starchy vegetables loaded with soluble fiber.
Leafy greens like spinach, kale, and Swiss chard are nutritional powerhouses. They contain virtually zero digestible carbohydrates, meaning they have no impact on your glucose levels. Furthermore, broccoli and cauliflower contain sulforaphane, a compound shown to mildly reduce blood sugar levels.
Fiber acts as a physical barrier in your gut, drastically slowing down the absorption of any sugars you eat alongside it. Filling half your plate with these fibrous vegetables is the easiest way to blunt a post-meal glucose spike.
Choosing the Right Grains
Carbohydrates are not inherently evil, but the type of grain matters immensely. In South Asian diets, for example, flatbreads are a staple. Patients often wonder, “Which chapati is good for diabetes?”
Traditional white flour (maida) chapatis will spike your blood sugar almost as fast as table sugar. Instead, you must switch to whole wheat chapati or, ideally, multigrain options that incorporate chickpea flour (besan), ragi, or oat flour.
These complex, unrefined grains have a lower glycemic index. They require your digestive system to work harder and longer to break them down, resulting in a slow, steady release of energy rather than a dangerous, sudden glucose flood.
How to Use a Blood Sugar Chart
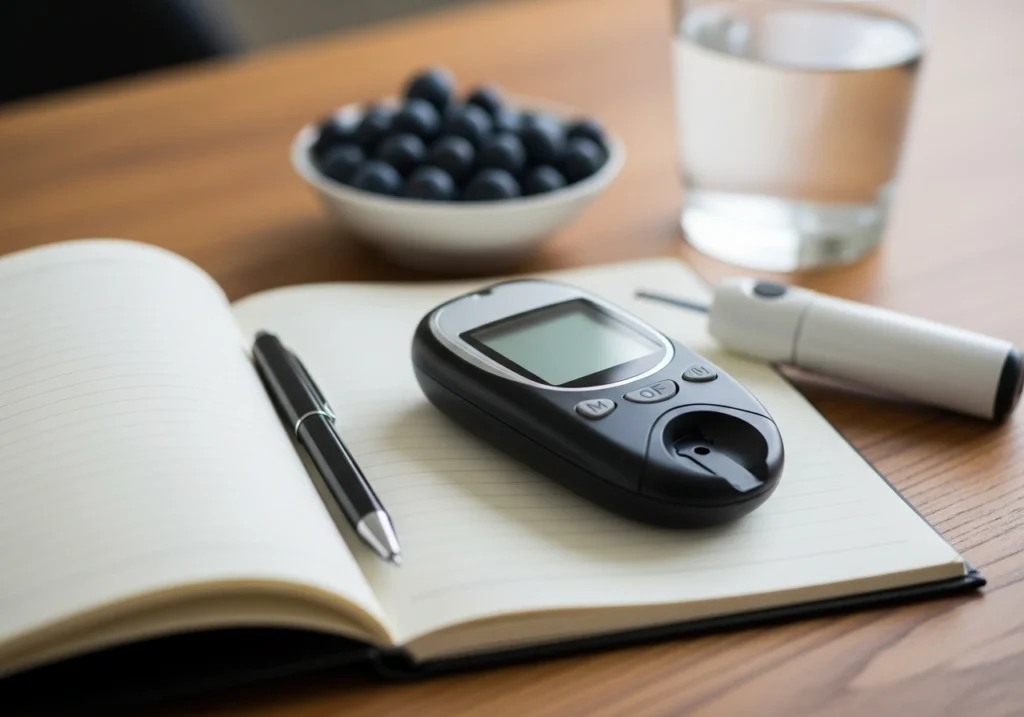
Having the chart is only step one; knowing how to extract actionable data from it is step two. I teach my patients a very specific three-step monitoring method.
Step 1: Measure Fasting Glucose. Check your blood first thing in the morning, before coffee or breakfast. This establishes your baseline insulin sensitivity after a night of fasting.
Step 2: Check Post-Meal Levels. Test exactly two hours after taking your first bite of a meal. This shows you how well your pancreas handles a specific carbohydrate load.
Step 3: Compare and Adjust. Cross-reference these numbers with your age-appropriate chart. If your post-meal numbers consistently exceed 180 mg/dL, you immediately know that the specific meal you just ate was too heavy in carbohydrates for your body to handle.
How to Control Blood Sugar Levels
Stabilizing erratic numbers requires a multi-pronged, disciplined approach. It is not about starvation; it is about strategic metabolic management.
Balanced Diet: Prioritize high-protein, high-fiber, and healthy-fat meals. Never eat “naked carbohydrates.” Always pair an apple with peanut butter, or rice with a heavy portion of chicken and broccoli, to slow digestion.
Regular Exercise: Your muscles are the largest consumers of glucose in your body. Walking for just 15 minutes immediately after a meal allows your muscles to soak up excess sugar from your bloodstream without even needing insulin.
Medication Adherence: Take your prescribed medications exactly as directed. Skipping doses of insulin or oral hypoglycemics causes severe roller-coaster fluctuations that damage your blood vessels over time.
Action Plan
Do not just read this information—put it into clinical practice today.
- Checklist Item 1: Purchase a reliable home glucometer and commit to monitoring your levels at least twice a day for two weeks to establish your baseline.
- Checklist Item 2: Request a comprehensive HbA1c blood test from your primary care physician to see your 90-day metabolic average.
- Checklist Item 3: Implement a strict 15-minute post-meal walking routine starting today to naturally lower your post-prandial spikes.
Frequently Asked Questions (FAQs)
What is a normal blood sugar level?
For a healthy adult without metabolic issues, a normal fasting blood sugar level sits between 70 and 99 mg/dL. Two hours after you begin eating a meal, your glucose levels should naturally drop back down below 140 mg/dL.
What is considered a dangerous blood sugar level?
A reading below 70 mg/dL is considered dangerously low (hypoglycemia) and requires immediately consuming fast-acting carbohydrates. Conversely, levels consistently spiking above 300 mg/dL represent severe hyperglycemia and require urgent medical intervention.
Is a blood sugar level of 170 normal after eating?
If you are currently managing type 2 diabetes, a post-meal reading of 170 mg/dL is entirely acceptable, as your clinical target is under 180 mg/dL. However, for an individual without diabetes, this number is too high and warrants a prediabetes screening.
Do normal blood sugar targets change with age?
Yes, our cellular insulin sensitivity naturally decreases as we grow older. Endocrinologists often relax fasting glucose targets to 80–130 mg/dL for seniors to proactively prevent dangerous hypoglycemic episodes that can lead to severe, life-threatening falls.
When is the best time to check post-meal blood sugar?
To get the most accurate clinical assessment of your body’s metabolic response, you should test your blood exactly two hours after taking your very first bite of food. This shows precisely how well your pancreas cleared the specific carbohydrate load of that meal.
Authoritative References:
- American Diabetes Association (ADA) – Blood Glucose Testing and Control
- Centers for Disease Control and Prevention (CDC) – Manage Blood Sugar
- National Institute of Diabetes and Digestive and Kidney Diseases (NIDDK) – Know Your Blood Sugar Numbers: Use Them to Manage Your Diabetes
- Mayo Clinic – Blood sugar testing: Why, when, and how
- World Health Organization (WHO) – Diabetes Fact Sheet
Related Posts


MORE from Author
Read More If you’re living with diabetes, knowing your blood sugar numbers isn’t optional—it’s critical for preventing complications. Just last month, a…
- Managing your metabolic health starts with understanding your numbers. Over the years in my endocrinology practice, I have handed out…

- Last week, a patient named Robert visited my clinic feeling exhausted and frustrated. Despite maintaining a strict diet during the…
- Blood sugar levels in newborns can fluctuate dramatically in the first few hours of life—but what is actually normal, and…